Updates for Nov 2026: The performance report, rebuilt

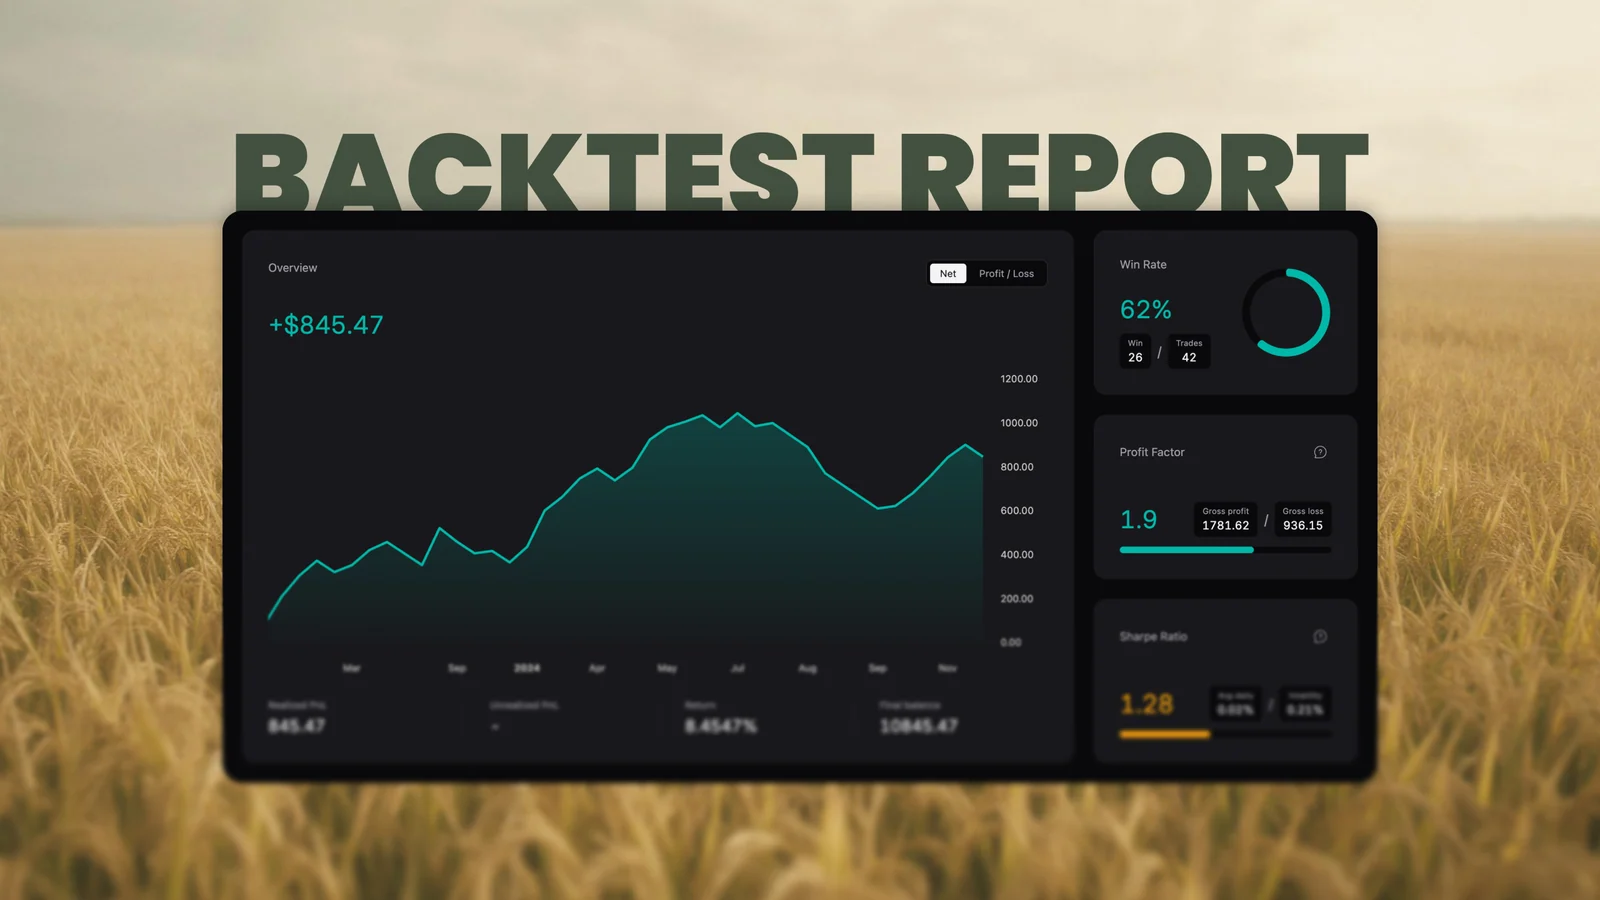
The performance report had an order problem. Four metric cards sat across the top, the trend chart underneath them, and anything that explained a number was buried in the card's fine print. To understand the headline you read the footnote.
That order is reversed now, and a few things that were spread across the page have moved into places built for them.
It opens on the trend
The PnL line comes first: one line, green above zero and red below it, over a fill that fades out towards the line. It spans three quarters of the width and the height of the three cards beside it, so the cards that read it share its column and the whole block lands on one height.
The overview switches between two readings of the same session — Net, one running total, or Profit / Loss, what the winners made against what the losers took. Switching redraws that card and nothing else.
The numbers you read once are in a drawer
Every card carried a second paragraph: consecutive wins, gross profit and gross loss, best and worst trade, trading days. Those are read once, not watched, so they live behind Statistics, grouped by the card they belong to.
The trades are behind Trades: every closed trade in the order it closed, costs included, so the list adds up to the realized P&L above it instead of to a slightly better number.
One filter for the whole page
The symbol select narrows everything — the metrics, the line, the calendar, both drawers, and the payload the AI review is given. A session built on six instruments now reads one of them at a time, without a second page to keep in sync.
The calendar counts the day
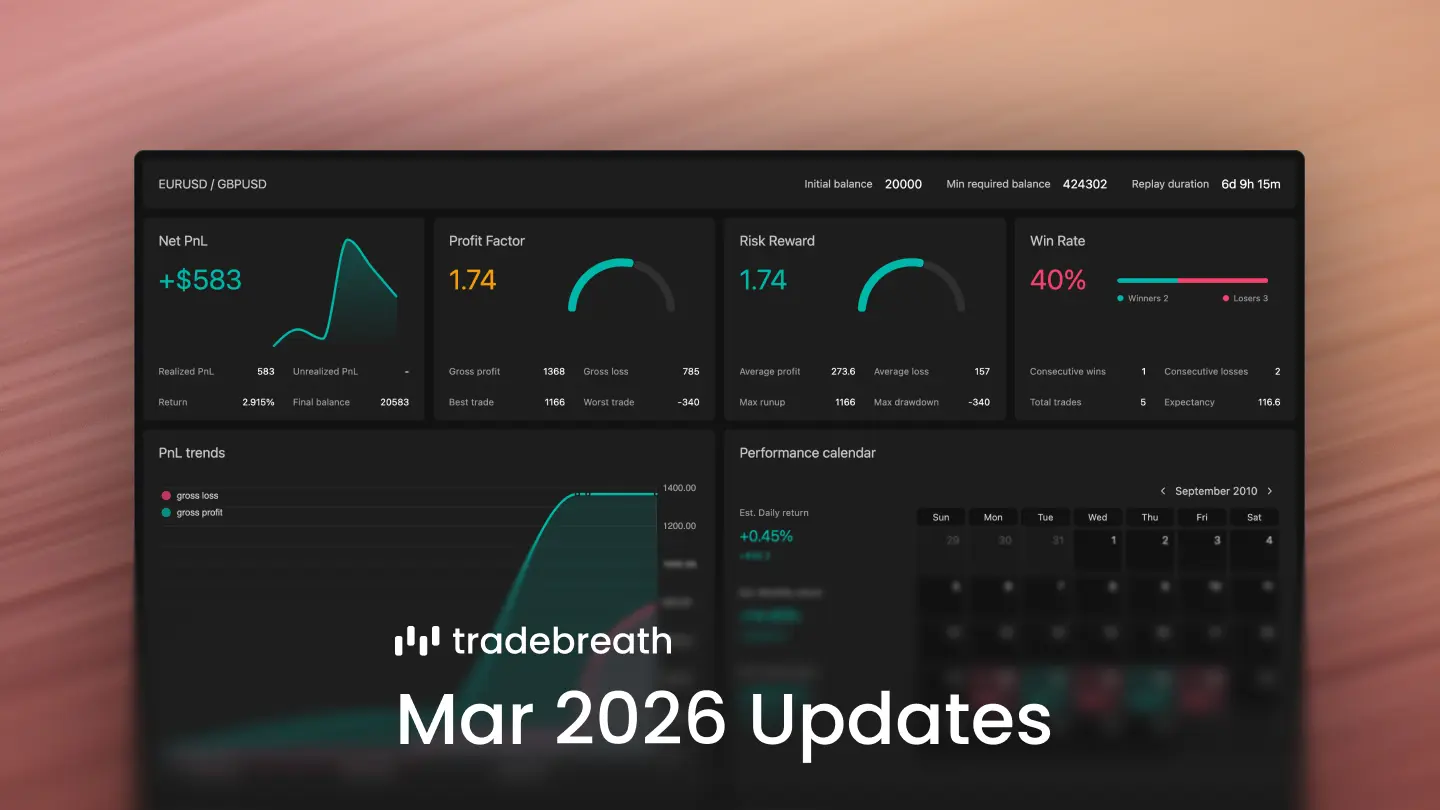
Each cell now says how many trades closed that day, and its percentage is measured against the equity the day opened on rather than the starting balance. Days that moved nothing stop printing $0. The month label is a picker that zooms out to years, which puts a 2015 backtest two clicks away.
The ratios explain themselves
Profit factor is gross profit over gross loss, closed trades only, banded where the literature puts the lines: under 1 the losers out-earn the winners, 1 to 1.5 is sound with thin margins, 1.5 and up is strong. The bands use the same colours as the bar beside the figure.
Sharpe is annualised from the daily series at a 0% risk-free rate, and it stays blank below 20 trading days instead of printing noise with a decimal point.
Two charts stopped promising the wrong thing
"Top positions" ranked closed trades by the size of their result, losers included, so "top" promised something it was not doing. It is Largest trades now, and each column carries the side — blue for long, orange for short — with a signed number over the bar.
"PnL distributions" was the flow diagram: symbol, then side, then win or loss. That decomposes a result; the distribution is the histogram in the simulation card below it. It is PnL breakdown.
Smaller things
- The simulation card no longer animates a result it has just computed, and it computes percentiles in one buffer that is refilled and sorted in place. The worst frame at 5,000 simulations went from 154ms to 97ms.
- Figures are set in Inter. Poppins has no tabular numerals, so a column of P&L could not be scanned.
- The report header carries the wordmark, and the page is called "Performance report" everywhere, including the button that opens it from a backtest list or a session's own row.
Open any saved backtest, press Report, and the session reads from the top without a paragraph between you and the next number.