Introducing Tradebreath: An all-in-one backtesting platform
TradebreathJuly 13, 2025· 3 min

Every trader has that one trade they wish they could take back. With Tradebreath, the expensive mistakes happen on a chart, not in your account.
Tradebreath is built around two core features: Bar Replay and tick-by-tick backtesting.
Bar Replay lets you rewind through real historical data and practice trades exactly as they would have played out, before risking real money. Tick-by-tick backtesting goes a step further, testing your strategy at the finest level of detail against real market conditions.
What Tradebreath does
Build a portfolio across asset classes
Tradebreath covers:
- Forex: Major and minor currency pairs.
- Stocks: 600+ major companies listed in the US.
- ETFs: A broad range of exchange-traded funds.
- Indices: Major market indices for benchmarking and index strategies.
- Cryptocurrencies: Bitcoin, Ethereum, and more.
- Commodities: Metals, energy, and agricultural products.
- Bonds: Government and corporate bonds.
That’s 800+ symbols and counting. Test one asset or mix several — stocks, forex, crypto, bonds, and more all live on the same platform, so diversifying a strategy is as easy as adding a chart.
Simulate real trades before you risk anything
Bar Replay is where Tradebreath shines — pick any timeframe, rewind through real historical data, and run trades exactly as they would have played out, no money on the line. Tick-by-tick backtesting goes a level deeper, replaying every single tick so even the most granular strategies are tested against real market conditions.
- Historical Data: Up to 20 years of minute-level data and 5 years of tick-level data for major forex pairs like EUR/USD, USD/JPY, and GBP/USD. That’s granular enough to test scalping and swing strategies against real market conditions, not just theory.
- Multi-Chart: Watch several assets or timeframes at once — even a forex and a stock strategy side by side in the same window. Handy when you’re backtesting a whole portfolio.
- Risk Management: Set risk per trade as a fixed percentage (say, 1% or 2% of your account) or a flat dollar amount, and define stop-loss and take-profit levels so exits are handled automatically.
- Chart Tools & Indicators: A comprehensive set of drawing tools and indicators covering the mainstream basics — moving averages, RSI, MACD, Fibonacci, and more. You’ll find what you need to build and refine most strategies.
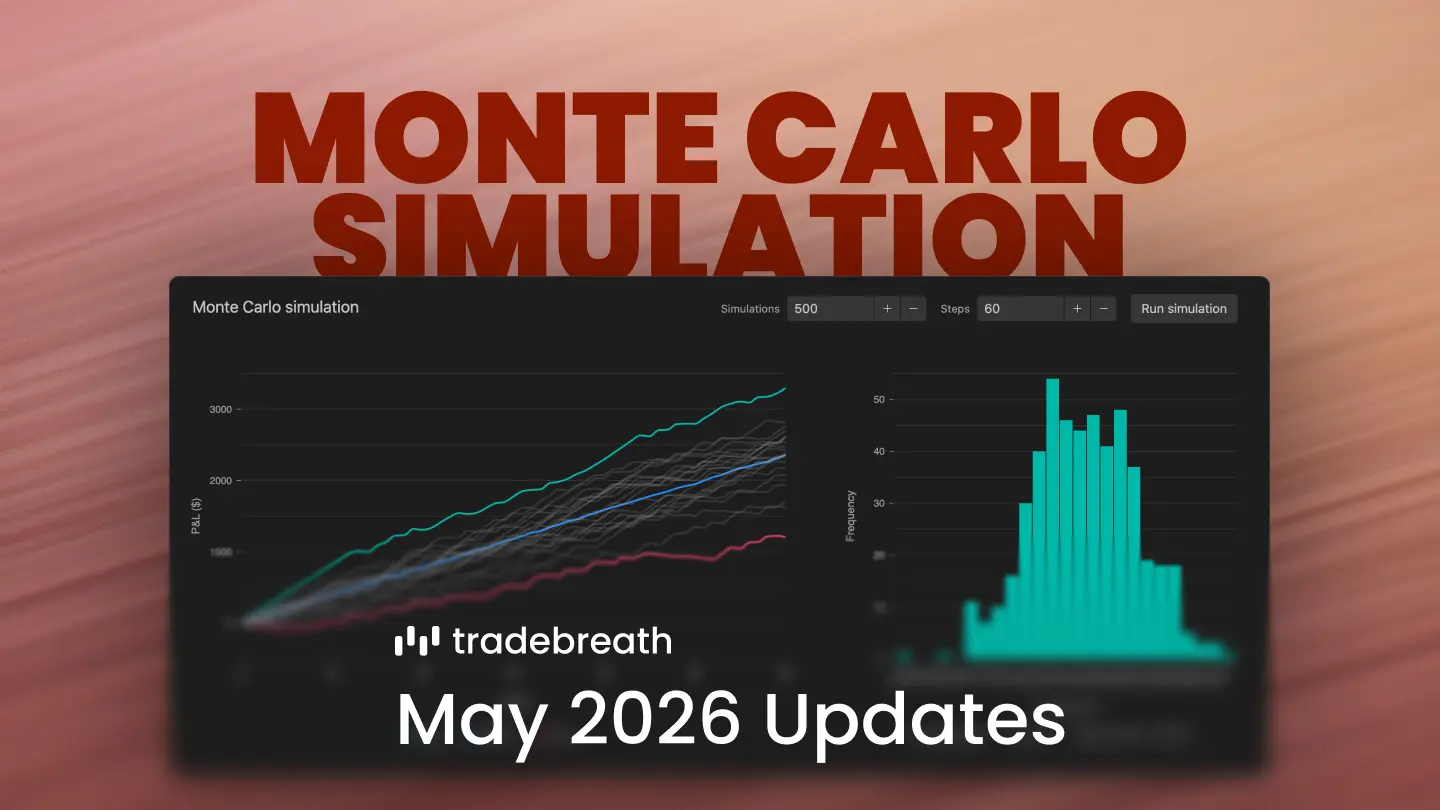
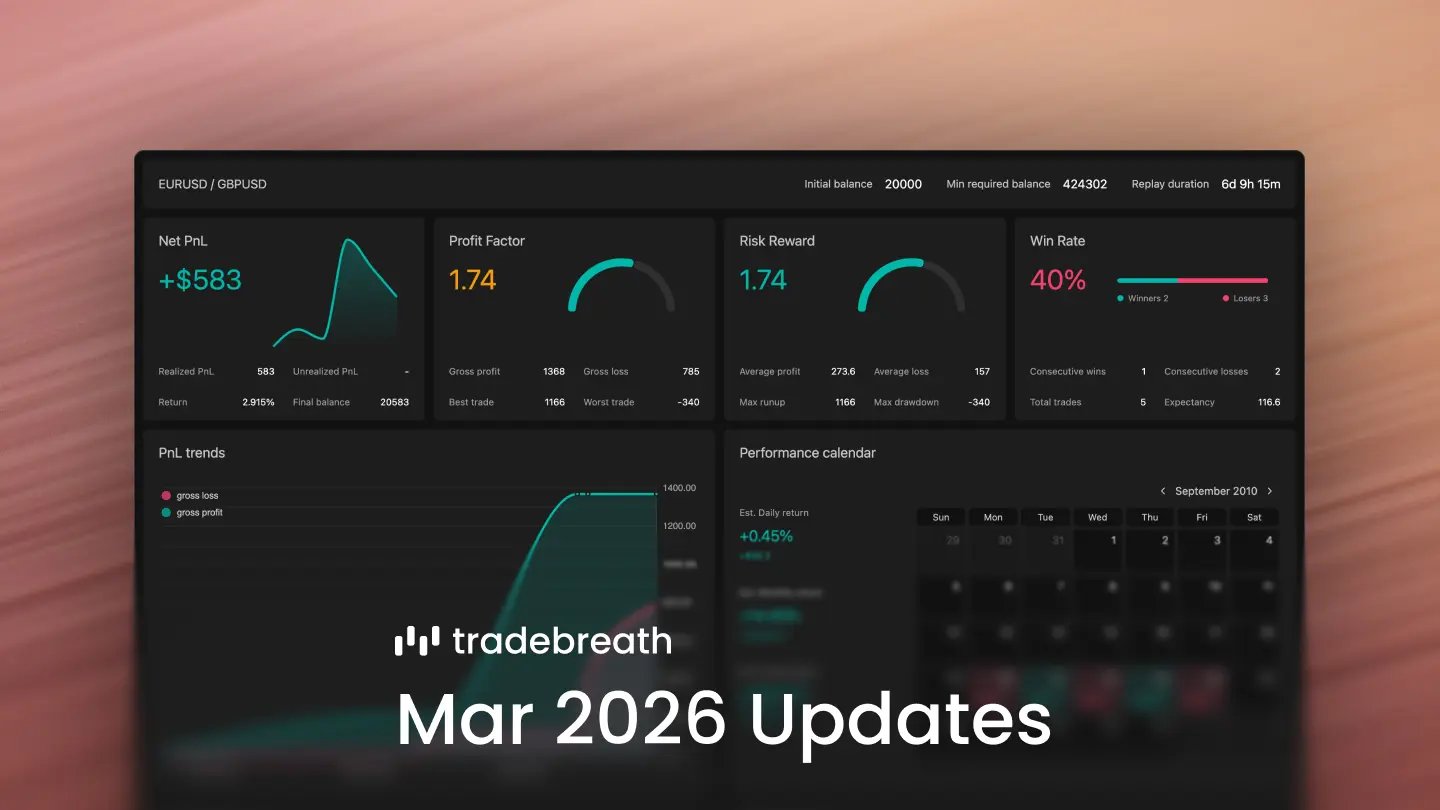
- Visual Analytics Report: A clear, chart-based breakdown of how a portfolio would have performed across asset types — stocks, ETFs, mutual funds — using historical data. Monte Carlo simulation shows the range of possible outcomes, and an AI analysis summarizes what your results actually mean in plain language.
Start free, upgrade when you’re ready
- Free Plan: Explore the platform, practice with historical data, and build basic trading plans — all at no cost.
- Pro Plan: A low monthly fee unlocks more data, advanced analytics, and multi-chart backtesting. When you’re ready to take trading seriously, it’s a small price to pay.