An AI Backtest Is Not a Faster Manual Replay

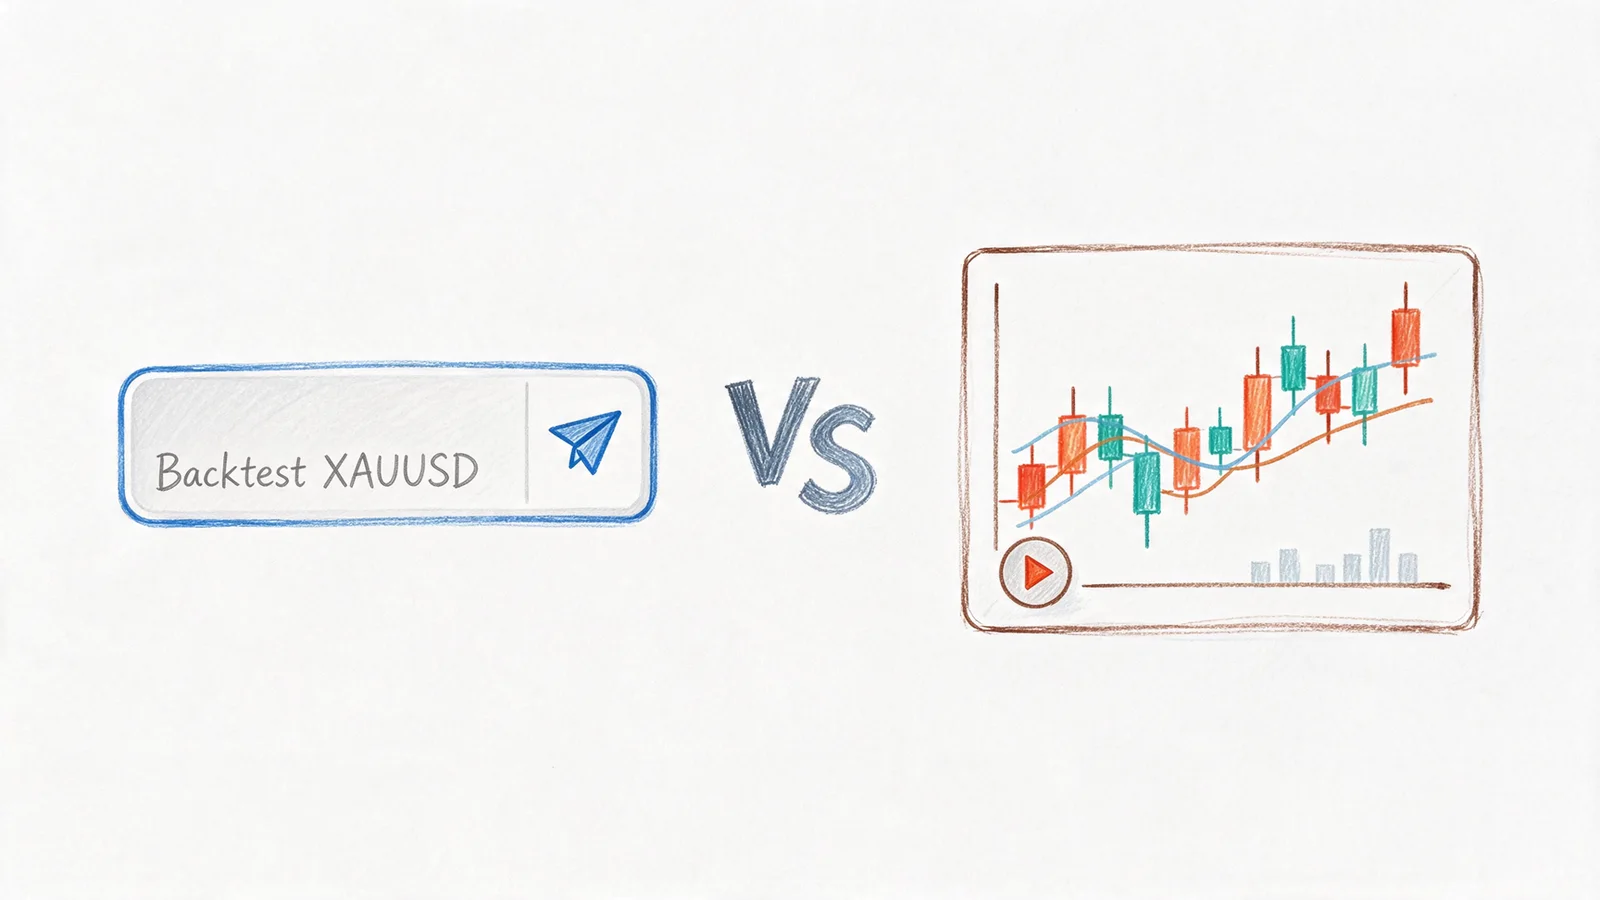
There are two normal ways to test a trading idea now, and people talk about them as if one is the sped-up version of the other.
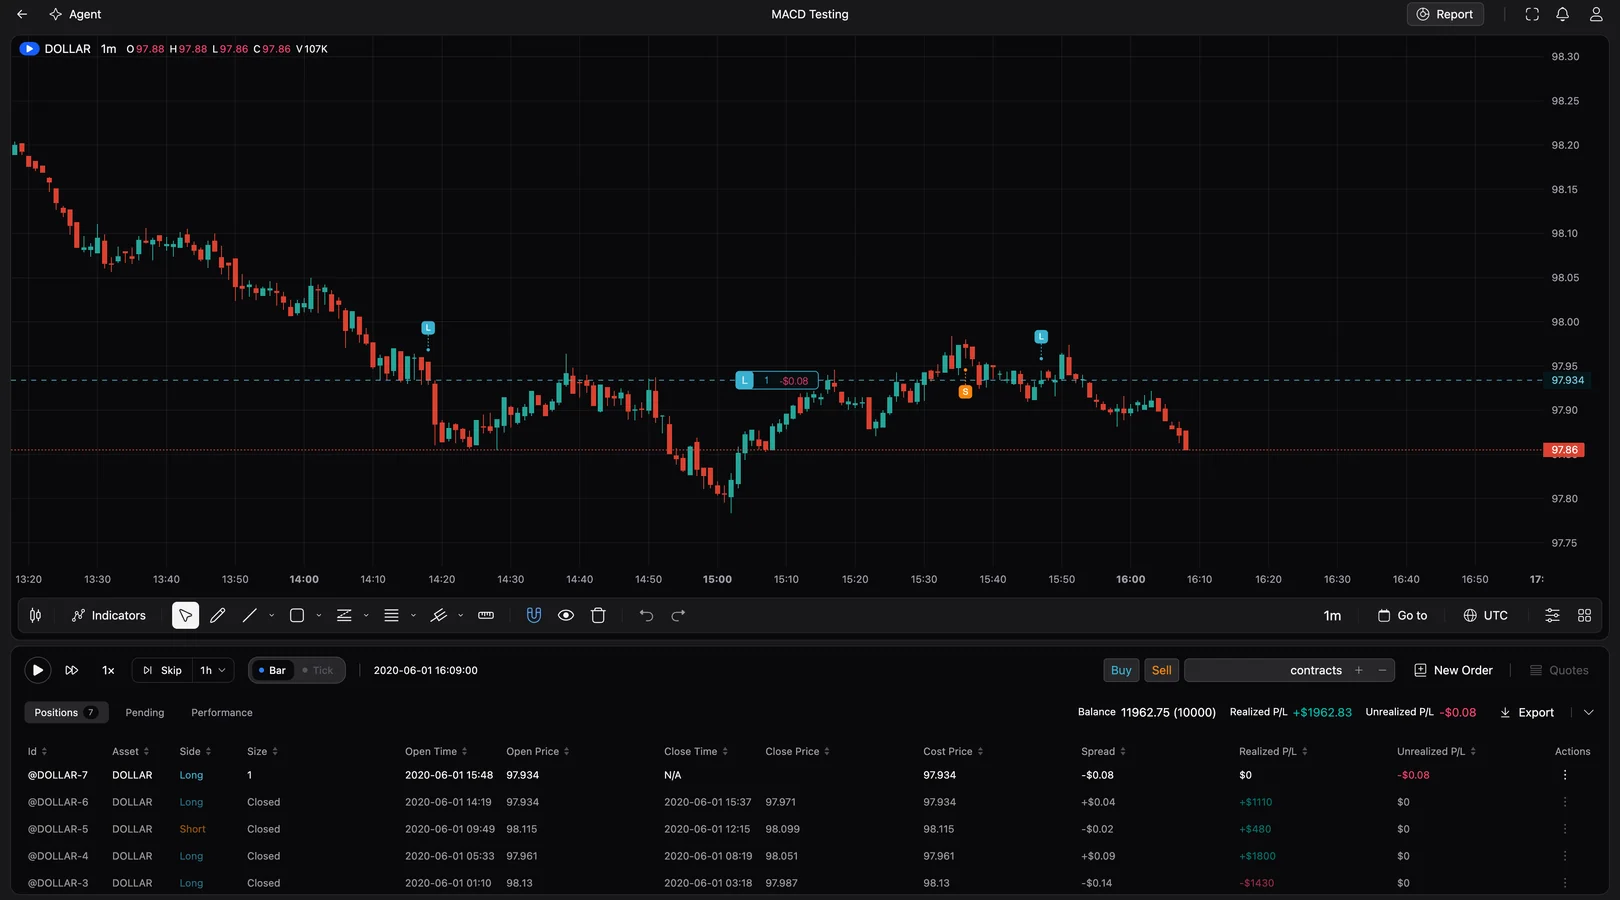
The first is a manual replay. You open a chart at some date in the past, blank out everything to the right of the cursor, and trade forward one bar at a time. You decide. You click. You watch what happens next.
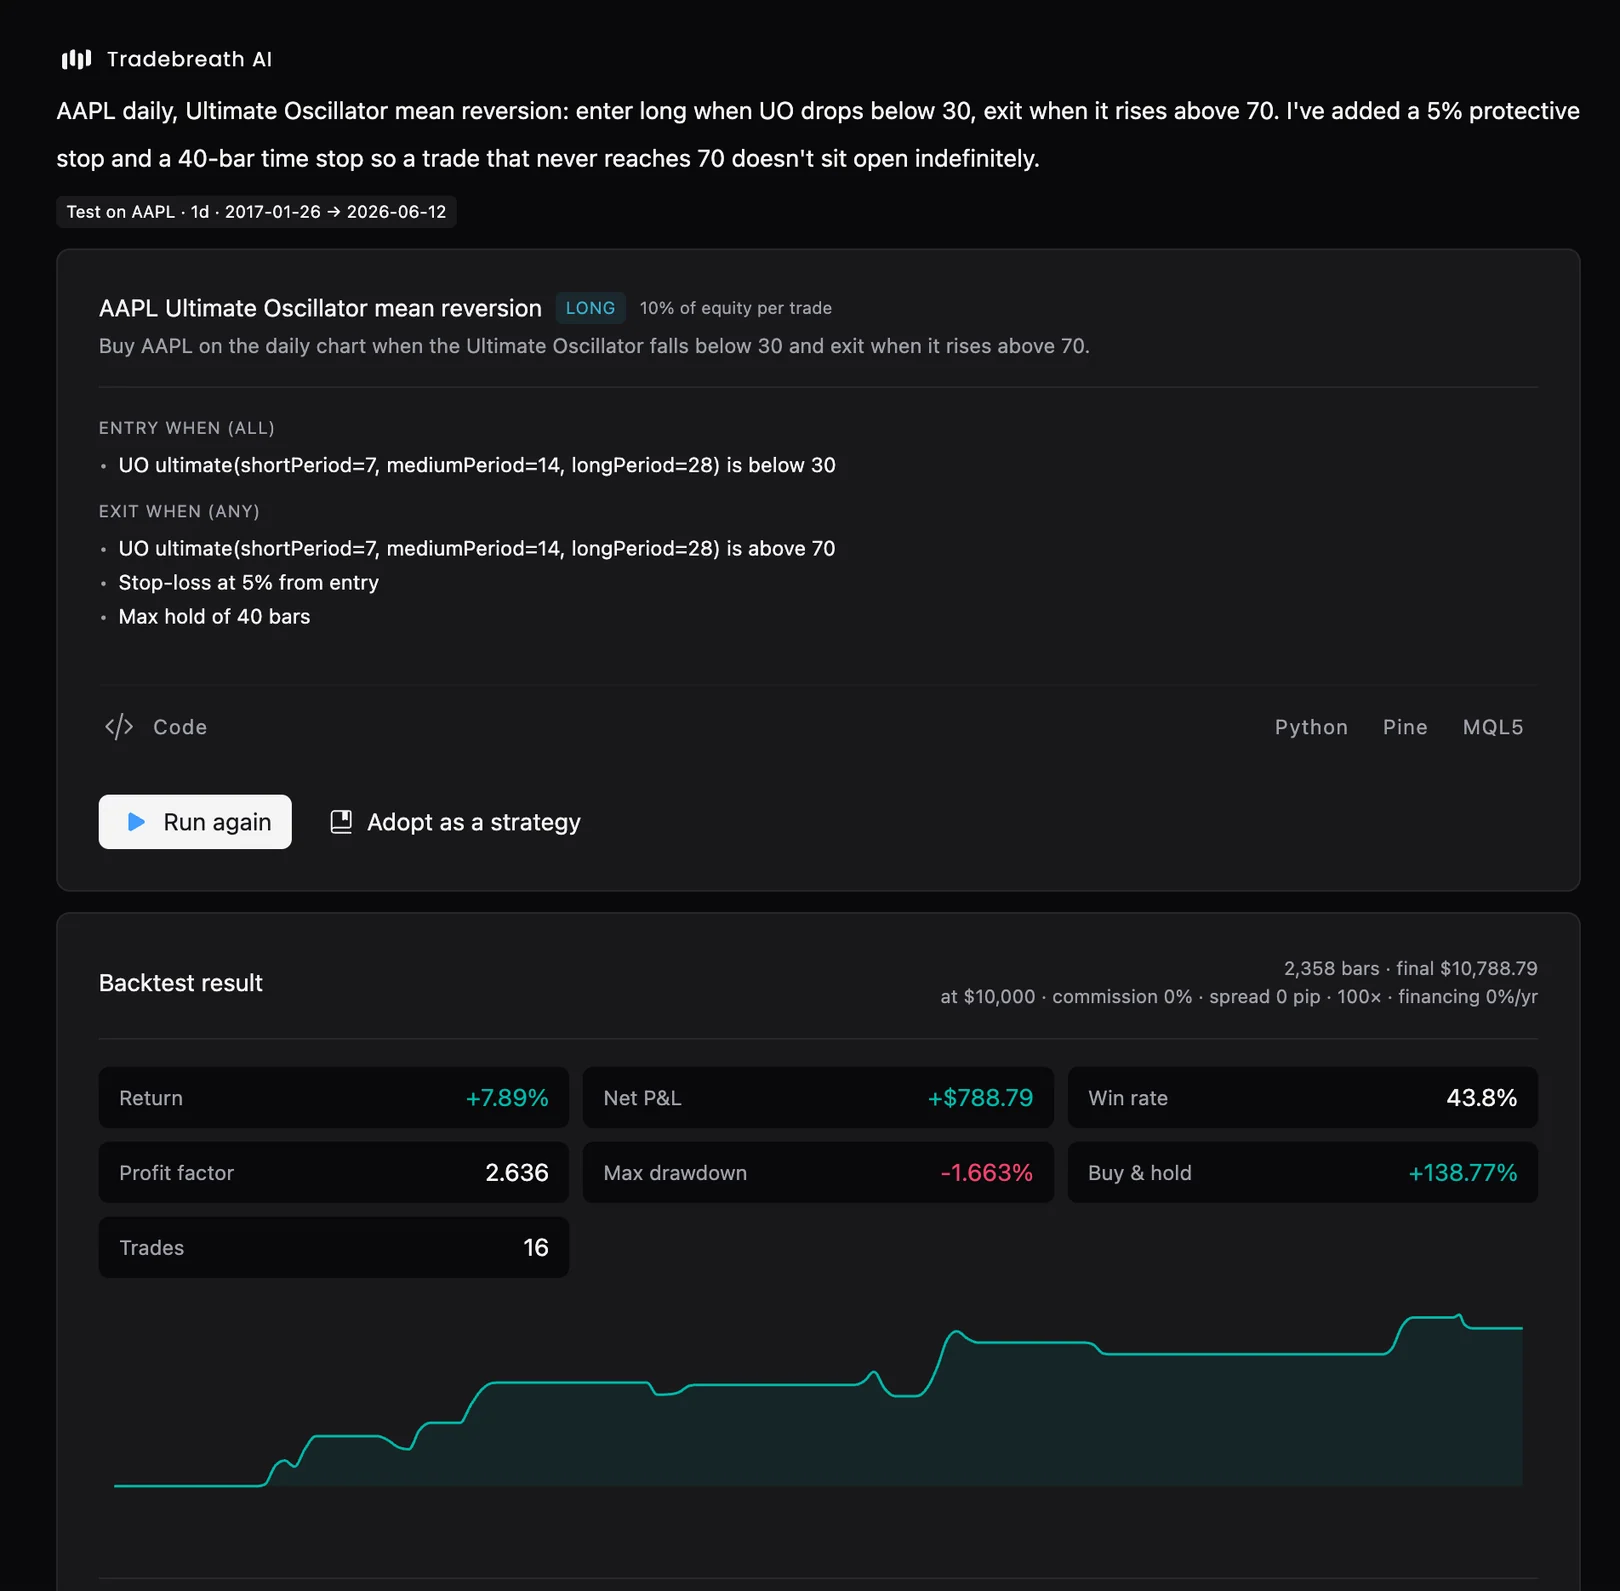
The second is an AI backtest. You describe the strategy in a paragraph, a program turns the paragraph into explicit rules, and those rules run across years of bars without asking you anything.
Both end in a report with a win rate, a profit factor, a drawdown and an equity curve. The symmetry is the trap. Those two reports do not measure the same thing at different speeds.
One records a rule. The other records a person
In a manual replay, the report is a record of your decisions. Every hesitation is in it. So is the trade you skipped because the last two lost, and the stop you moved, and the afternoon you got bored and doubled your size. If your concentration fell off after the third hour, that is inside the drawdown figure, whether or not you meant it to be.
An AI backtest leaves the person out. Nobody gets tired at bar seven thousand. Every signal the rules produce is taken, including the ugly ones, in the same size, at the same cost, on trade one and on trade four hundred.
So when you say "the AI version of my setup made 40% and I made 12% on the same chart", you have compared a rule to a person and drawn a conclusion about the person. The two runs differ by a few thousand trades and by everything that makes you you. The gap is real, and it is interesting, but it is not a speed difference. It is a category difference.
Thirty trades is an anecdote, and a replay rarely gets more
A manual replay is slow on purpose. You are looking at one bar at a time with the future hidden, which is the only way to feel what an unknown future feels like. The cost is that a focused session gets you through a few dozen trades, and a good idea usually needs more than that to be measured.
Take a system that wins 55% of its trades. After 30 trades, the 95% interval around that win rate runs from about 37% to about 73%. After 300 trades, from 49% to 61%. After 1,000, from 52% to 58%.
At 30 trades you cannot tell a good system from a mediocre one. The interval is wider than the effect you are hoping to find. This cuts in both directions: a losing 30-trade replay does not prove the idea is bad either.
What thirty trades can settle is a different and more useful question. Can this idea be stated as a decision you are able to make in real time, with the right side of the chart dark, before you know how it ends? That is worth an afternoon. Whether it makes money is not a question thirty trades will answer.
What the wider run buys you
Breadth is the obvious part. The same rule over six symbols and ten years is tens of thousands of hourly bars, and it takes seconds. You would not finish that by hand in a season of evenings.
The less obvious part is consistency of conditions. A rule-based run charges the same spread on every fill, the same commission on every trade, and the same overnight financing each night a position is held. Your replay charges what you remembered to write down, which on a busy morning is not always the same thing.
Then there is the part you cannot do by eye at all: counting how often a condition was true. A filter that fires on 92% of bars, something like RSI above 20, is not a filter. It is decoration, and on the trade list it will look like a diligent entry rule. A run that counts the bars can tell you that; a replay cannot, because you only see the bars where you were paying attention.
Where the AI run quietly cheats
Three things go wrong, and none of them shows up in the report.
The first is that the description has to become executable. "Buy pullbacks in a strong uptrend" is not a rule until someone decides what strong means, which moving average, which tolerance, how far a pullback has to go. The machine will make those decisions, and they may not be the ones you had in mind. This is uncomfortable and it is the most valuable thing the exercise does: it forces your vague idea into a sentence that is either true or false on a given bar. Sometimes that sentence is not the idea you thought you had.
The second is hindsight. You have already seen the chart. Ask for a strategy that avoided the chop of 2022 and you will get one, because you told it to. That is a memory wearing a rule's clothes. Any condition that could only be written by someone who knows what happened next is not testable, and it will produce a beautiful equity curve that means nothing.
The third is volume of attempts. Twenty variants in ten minutes is easy, and then you keep the best one. The best of twenty is not the twentieth; it is the maximum of twenty draws, and the maximum of twenty draws sits above the average of twenty whether or not there is any edge underneath. Your report never tells you where it ranks among the runs you threw away.
So count. Before you look at the result, write down how many variants you are going to try. If the honest number is forty, then the profit factor you are reading is the highest of forty estimates of something that may be noise. Treat it as a hypothesis and test it on data you did not fit it on, or accept that you are looking at luck with a decimal point.
The gap between the two has a number
The gap is measurable. It is also the number almost nobody computes.
Tradebreath can take a finished manual session and infer the strategy behind it. The work is deterministic, not a model's opinion: it looks at the bars where you entered, scores the indicator conditions that were true at those entries, reads direction, exits and position size off what you actually did, and assembles the strongest rule set the library can express. Then it re-runs that rule set over the same window and matches the resulting trades to yours. A match means the same direction and an entry within one bar.
What comes back is a reproduction rate: how many of your positions a mechanical version of you would have taken.
Three readings, and they mean different things.
If it reproduces most of your trades and the P&L is close to yours, the edge is in the rule. You can now run it wide, on more symbols and more years, and find out whether it survives outside the window you chose.
If it reproduces most of your trades but makes less money, the entries were not where your advantage lived. Look at the exits and the sizing, because that is what the inferred version flattened out.
If it reproduces half or fewer, then half of what you did cannot be written as a rule. Some of that is reading you did without knowing you were doing it, and some of it is trades you would struggle to justify. The positions that went unmatched are listed, not averaged away. Go through them and name what you saw. A named thing can be tested. An unnamed thing is a coin you are paying commission to flip.
One caveat, stated plainly: with fewer than twenty positions the rate is indicative only. This is a small-sample tool by design, because it is measuring a small-sample activity.
The order that wastes the least time
Replay by hand first, and keep the sample small. The question you are answering is whether this is a decision you can make in real time, not whether it is profitable.
Then write down the rules that produced your better trades and run them across years and symbols. Decide how many variants you will allow before you start, and stop at that number.
Then take the rule back to the chart and try to follow it exactly, with the sentence in front of you. Most ideas die here. The ones that survive were worth the two earlier steps.
The two methods are not competing. One tells you what a rule does across thousands of trades. The other tells you what you do across thirty. Traders usually want the second number and go looking for the first, then wonder why a 40% backtest turns into a 12% year.